
What is OpenTelemetry? A Plain-English Guide for Beginners
Modern applications are complex.
They run across:
- Servers
- Containers
- APIs
- Cloud services
When something breaks, finding the root cause is hard.
This is where observability comes in.
And one of the most important tools in this space is:
👉 OpenTelemetry
In this guide, we’ll explain OpenTelemetry in plain English — no confusing jargon.
What is OpenTelemetry?
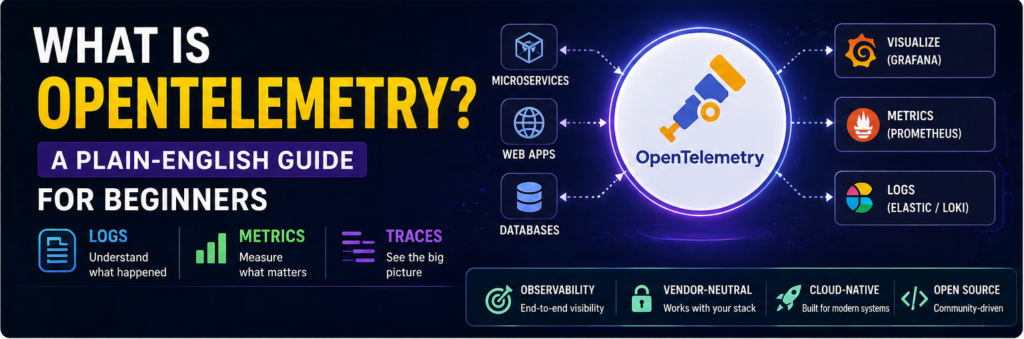
OpenTelemetry is an open-source framework used to collect:
- Logs
- Metrics
- Traces
These help you understand what’s happening inside your system.
Why OpenTelemetry Matters
Without observability:
- You don’t know why things fail
- Debugging takes hours
With OpenTelemetry:
👉 You can see everything
Key Concepts (Simple Explanation)
1. Logs
Text records of events.
Example:
- Error messages
2. Metrics
Numerical data.
Example:
- CPU usage
- Request count
3. Traces
Track a request across services.
Example:
- User request → API → Database
How OpenTelemetry Works
- App generates data
- OpenTelemetry collects it
- Sends to backend (like Grafana)
- You visualize it
Components of OpenTelemetry
- SDK
- Collector
- Exporters
Real Example
User visits your website:
- Trace tracks request
- Metrics track response time
- Logs capture errors
Why It’s Popular
- Vendor-neutral
- Works with all major tools
- Cloud-native ready
Tools That Use OpenTelemetry
- Prometheus
- Grafana
OpenTelemetry vs Traditional Monitoring
| Feature | Traditional | OpenTelemetry |
|---|---|---|
| Data Type | Limited | Logs + Metrics + Traces |
| Flexibility | Low | High |
| Vendor Lock-in | Yes | No |
Use Cases
- Debugging microservices
- Monitoring APIs
- Performance optimization
Getting Started (Simple Way)
- Install SDK
- Add instrumentation
- Send data to backend
Best Practices
- Start small
- Monitor key services
- Use dashboards
Common Mistakes
- Collecting too much data
- Ignoring traces
- Not using visualization tools
Real-World Insight
Most outages are hard to debug because:
👉 there’s no visibility
FAQs
Is OpenTelemetry hard?
No, once basics are clear.
Is it free?
Yes.
Final Thoughts
OpenTelemetry is becoming the standard for observability. If you're serious about DevOps, learning it is essential.